Data Tables
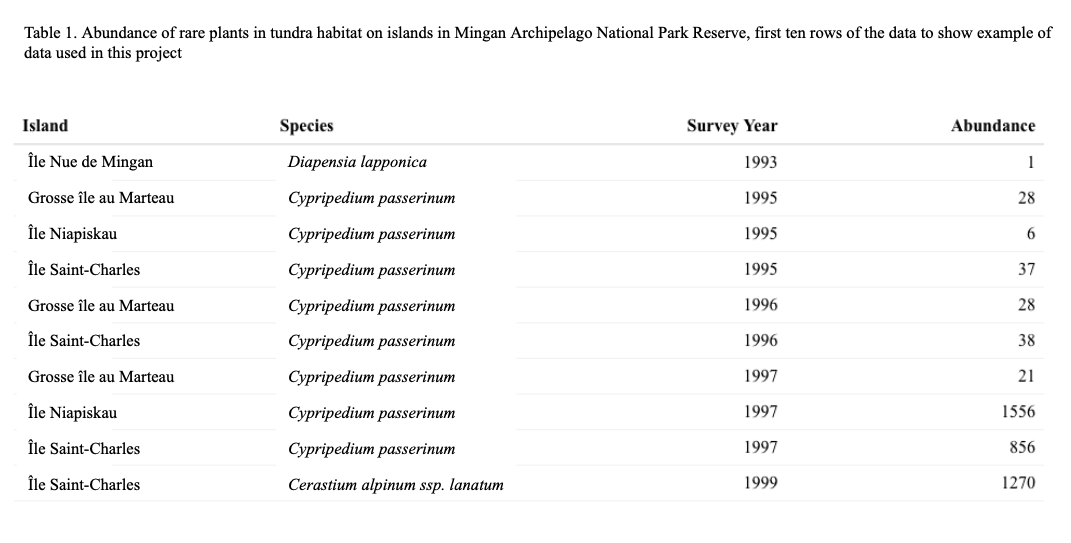
Above is one of the four abbreviated and simplified data tables we used in this project from Parks Canada. The “Island” column represents each island that was surveyed for rare plants. The “Species” column represents the scientific name of each rare plant species surveyed. The “Survey Year” column represents the year each survey was conducted. The “Abundance” column represents the abundance of each rare plant species, grouped by individual colonies.
Our predictor variable is time, in which species can colonize an island and either thrive or die, and our response variable is abundance of rare species colonies. Time is reported linearly in the Parks Canada report, thus it is a continuous variable. In Table 1, we have modified how time is represented, as a categorical variable by removing values of zero from the data. Within the gaps in time in which surveys were conducted, plant colonies would not have become extirpated, then recolonized on the islands they are found on. Graphs with and without these gaps in time are in the Exploratory Graphs section below.

This table representing island size and distance to mainland helps give a clearer picture of the islands surveyed in the Parks Canada study. Islands surveyed in Mingan Archipelago National Park Reserve are represented in the "Island" column, their area is represented in the "Area" column in kilometres squared, and their distance to the mainland is represented in the "Distance to Mainland" column in kilometres.
Exploratory Graphs
Figure 1 shows the raw abundance data, regardless of species, for all 11 of the islands. Survey year is shown on the x-axis, while Abundance is shown on the y-axis. We noticed reoccurring values of zeros in all of the species, which were different from years not surveyed which were recorded as "NA". Given that the same species spike in abundance together in certain years, we suspected that some years that were not surveyed were recorded as zero instead of NA, so we created a new figure that removed any values of zero, which can be seen in Figure 2 above. All other figures and analyses in this project were created without the inclusion of these zeros.
11 islands in the park reserve were included in this study, which makes the above graphs busy and difficult to explore for trends. Therefore, we separated the data based on habitat type (coastal or tundra) and island, then plotted the abundance for each plant species that is surveyed, seen in the figures below.
11 islands in the park reserve were included in this study, which makes the above graphs busy and difficult to explore for trends. Therefore, we separated the data based on habitat type (coastal or tundra) and island, then plotted the abundance for each plant species that is surveyed, seen in the figures below.
Coastal Habitat graphs
Figures 3a and 3b show the abundance of species organized by island size, smallest to largest, adjusted to reflect the removal of all zeros from the data set.
Most of the coastal habitats had one species of rare plant per island, except for Île du Havre and Île à la Chasse, which both had two. These are the third largest and second largest islands in the survey respectively. In terms of abundance, the abundance in the coastal habitats was relatively higher on Sainte-Geneviève, Île du Havre, and Île à la Chasse.
Most of the coastal habitats had one species of rare plant per island, except for Île du Havre and Île à la Chasse, which both had two. These are the third largest and second largest islands in the survey respectively. In terms of abundance, the abundance in the coastal habitats was relatively higher on Sainte-Geneviève, Île du Havre, and Île à la Chasse.
Tundra Habitat Graphs
Figure 4a and 4b shows the abundance data with all the zeros removed from the data set organized by island size, smallest to largest, for the tundra habitats.
The tundra habitats had more rare plant species than the coastal habitats, with 2 species on each island, except for Île Nue de Mingan which had four, Grande Île which had three, and Île Quarry which had one. In terms of abundance, the tundra habitats on the largest two islands appeared to support less rare plant abundance regardless of species compared to the smaller islands.
The tundra habitats had more rare plant species than the coastal habitats, with 2 species on each island, except for Île Nue de Mingan which had four, Grande Île which had three, and Île Quarry which had one. In terms of abundance, the tundra habitats on the largest two islands appeared to support less rare plant abundance regardless of species compared to the smaller islands.
