Results
Diversity Values |
Species richness was calculated for each island, and organized by both island area and distance to mainland to compare the values.
In Table 3, species richness values for each islands are displayed. Islands surveyed in Mingan Archipelago National Park Reserve are represented in the "Island" column, their area is represented in the "Area" column in kilometers squared, and the number of rare plant species observed is represented in the "Species Richness" column. The islands are arranged from smallest to largest in area to explore how island size is related to the diversity of rare plant species.
In Table 4, species richness values for each islands are displayed. Islands surveyed in Mingan Archipelago National Park Reserve are represented in the "Island" column, their distance to the mainland is represented in the "Distance to Mainland" column in kilometers, and the number of rare plant species observed is represented in the "Species Richness" column. The islands are arranged from smallest to largest distance to the mainland to explore how this is related to the diversity of rare plant species.
Correlation and Regression
Species Richness
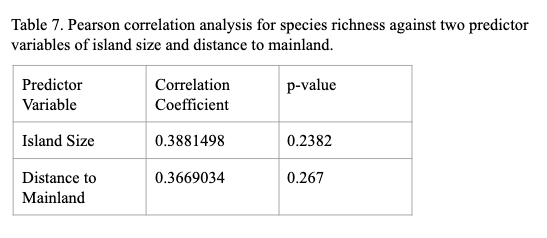
The Pearson correlation coefficients for species richness against both predictor variables, and their corresponding p-values, can be seen in Table 7. Using a standard table for critical Pearson correlation coefficients, at N=11, the standard critical r value is 0.6 at an alpha level of 0.05. Therefore, the relationships between species richness and the two predictor variables are not significant.
|
|
Even though the correlation showed no significant relationship between species richness and the two predictor variables, we decided to plot and run the regression to visualize the relationship (or lack thereof). Figure 5 shows the regression line, function, R², and p-value for richness and island size, while Figure 6 shows these values for richness and distance to mainland. The low R² values suggest that the model does not explain very much of the response variable.
|
Shannon Wiener Diversity Index

The Pearson correlation coefficients for Shannon Wiener Diversity Index against both predictor variables, and their corresponding p-values, can be seen in Table 8. Using a standard table for critical Pearson correlation coefficients, at N=11, the standard critical r value is 0.6 at an alpha level of 0.05. Again, the relationships between species diversity according to the Shannon Wiener Diversity Index and the two predictor variables are not significant.
|
|
Even though the correlation showed no significant relationship between diversity and richness, and the two predictor variables, we decided to plot and run the regression to visualize the relationship (or lack thereof).
|
|
Figure 7. The relationship between Shannon Wiener Diversity Index and Distance to Mainland, & Shannon Wiener Diversity Index and Island Size; including regression line.
|
|
Discussion
We do not see any trends in the data to support the theory of island biogeography as it relates to rare species in the Mingan Archipelago. Some of the largest islands in this study only contain 1 or 2 rare species, with the most being 4. The largest island in our study, Grande Île, has 4 rare species, as we would expect but so does one of the smaller islands, Île Nu de Mingan.
Species richness and the Shannon's diversity index are not significantly correlated with either island size or distance to mainland, based on the Pearson correlation analysis. This, in addition to the low R² values from the regression, suggest that neither island size nor distance to mainland are suitable predictor variables for looking at the diversity and abundance of rare plant species in the Mingan Archipelago.
One explanation for this would be the scope of our study is too small to detect any significant relationships related to species diversity, abundance, and island biogeography theory. Only a limited number of plant species were studied, meaning that the quantity of data was limited. Perhaps looking at all plant species, rather than only the rare species, would give a better idea of how these variables are related. However, data on the overall species composition of vegetation communities in the Mingan Archipelago currently either does not exist, or is not available publicly.
Anthropogenic activity is another possible explanation for why species diversity is not increasing with island size or distance to mainland. Even with perfect use, campsites and hiking trails cause habitat fragmentation and degradation, which can negatively affect plant populations.
Additional research will be required to further explore our research question. Increased surveying frequency and accuracy, and improved knowledge of the impacts of tourism and infrastructure can help us get a better understanding of this distribution.
